What Actually Happens After fetch()
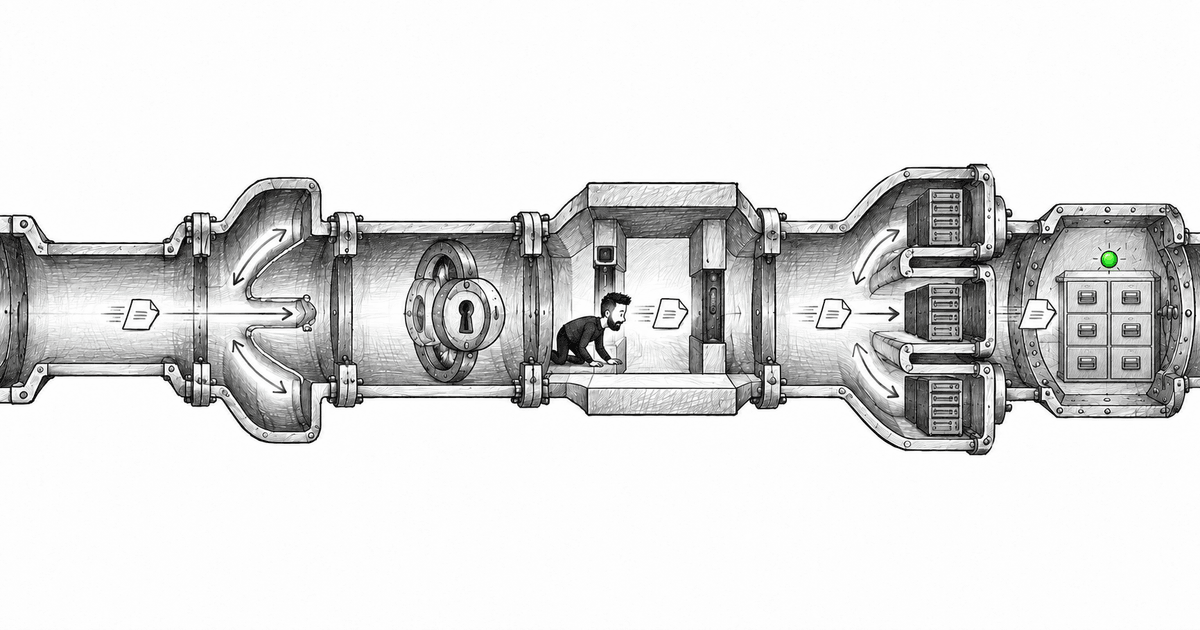
A user clicks Place order. Your component calls fetch('/orders'). A moment later, it either receives JSON or lands in catch.
That can feel like one operation. It is not even close.
Between the click and the response, the request may cross a DNS resolver, an encrypted connection, a CDN, a load balancer, an application process, a cache, and a database. Then the response has to travel back through most of that chain. Any link can be slow, unavailable, misconfigured, or perfectly healthy while the next one is failing.
Frontend engineers do not need to become network engineers to work with this well. But we do need a useful picture of what happens after fetch(). Without it, every failure becomes "the API is broken," and that sentence is usually too vague to help anyone.
So let me follow one request all the way through.
Start with the URL
Imagine the browser is about to send this:
await fetch('https://api.shop.example/orders', {
  method: 'POST',
  headers: { 'Content-Type': 'application/json' },
  body: JSON.stringify({ cartId: 'cart_42' }),
});
Before any application code runs, the browser has several questions to answer:
- Where is
api.shop.example? - Can I establish a secure connection to it?
- Which machine should receive this request?
- Is there already a connection I can reuse?
The URL is not an address a network understands directly. It is a human-readable instruction that has to be resolved into infrastructure.
DNS finds the entrance
DNS turns api.shop.example into an IP address, or more often into another hostname that eventually leads to one.
The browser first checks caches: its own, the operating system's, perhaps the local network's. If there is no usable answer, a DNS resolver looks up the records. The final result may point directly to a server, but production systems often point to a CDN or load balancer instead.
This is the first useful debugging boundary. If DNS is wrong, your backend can be completely healthy and still receive nothing. The browser may report DNS_PROBE_FINISHED_NXDOMAIN, while an application dashboard shows zero errors because the request never reached the application.
That distinction matters. "No server logs" does not always mean "the browser did not send it." It may mean the browser could not find the server.
The browser creates a secure connection
Once the browser has an address, it needs a connection. With HTTP/1.1 or HTTP/2, that normally means TCP. With HTTP/3, it uses QUIC over UDP. The transport details differ, but the practical goal is the same: create a reliable path for exchanging data.
Because the URL uses HTTPS, TLS also has to establish trust and encryption. The server presents a certificate for the domain. The browser checks that the certificate is valid, trusted, not expired, and actually covers api.shop.example.
If that fails, React never gets an HTTP status. There is no 502 response to inspect. The secure conversation did not begin.
This is why "network error" is such an unhelpful bucket in frontend code. It can mean offline Wi-Fi, DNS failure, TLS failure, a blocked connection, a proxy problem, or a request cancelled by our own code. Those failures happen before an API can return a neat JSON error.
The first machine may not be your backend
Suppose DNS and TLS work. The request reaches the public edge of the system.
That edge might be a CDN such as CloudFront or Cloudflare. Static files can be returned there without touching the application. Dynamic requests usually continue inward, but the edge can still enforce rate limits, reject suspicious traffic, terminate TLS, or attach routing headers.
Next may come a reverse proxy or load balancer. Its job is not to understand the shopping cart. It decides which healthy application instance should receive the request.
browser
  -> DNS
  -> secure connection
  -> CDN / edge
  -> load balancer
  -> application instance
This is where one public API becomes many private processes. The user sees api.shop.example. Behind it, five application instances may be serving traffic. A health check tells the load balancer which instances are ready. If one process crashes, new requests go elsewhere.
That sounds like an infrastructure detail until application state lives only in the memory of one instance. Then the first request creates a checkout session on server A, the second lands on server B, and the session appears to have vanished. Horizontal scaling has exposed an application design problem.
We will return to that later in this series. For now, the important point is simple: a domain name does not identify one process.
Now the application gets a turn
Only after all of that does the request reach the route handler we usually call "the backend."
The application parses the body, authenticates the user, checks authorization, validates the input, and decides what operation "create order" means. It may call another service. It may read Redis. It may open a database transaction. It may publish a job to a queue.
For our order, the simplified path could be:
validate request
  -> load cart
  -> confirm current prices
  -> reserve inventory
  -> create order
  -> return order id
Each arrow is another boundary and another possible failure.
This is why a backend can be "up" while a request still fails. The process responds to health checks, but the database connection pool is exhausted. Or Redis is unavailable. Or the inventory service times out. A green server is not the same thing as a successful operation.
The database is not just storage at the end
The database often decides whether the whole operation is trustworthy.
Creating an order may require several writes that must succeed together: insert the order, reserve stock, and record the payment attempt. If two writes succeed and the third fails, we do not want half an order. A transaction gives the backend a boundary: commit the whole change, or roll it back.
The query also has a cost. Missing indexes can turn a small lookup into a scan across millions of rows. A lock held by another transaction can make a fast query wait. Too many concurrent requests can exhaust the connection pool even when the database itself still has CPU available.
From the browser, all three may look like a slow spinner.
That is the recurring theme of this journey: the UI sees the total time, not the layer that spent it.
The response walks back through the system
When the application finishes, it returns an HTTP response. That response passes back through the load balancer and edge, crosses the encrypted connection, and reaches the browser.
Then fetch() does something that still catches people: it resolves for HTTP errors. A 400 or 500 is a successful network exchange, so the promise resolves. We have to inspect response.ok ourselves.
const response = await fetch('/orders', options);

if (!response.ok) {
  const problem = await response.json();
  throw new OrderRequestError(response.status, problem);
}

return response.json();
The promise rejects when the browser cannot complete the exchange at all, or when our code aborts it. Those are different categories from a backend that deliberately returned a validation error.
A useful frontend error model keeps that distinction:
- No response: connection, DNS, TLS, offline state, timeout, or cancellation.
- HTTP response with a problem: authentication, validation, conflict, rate limit, or server failure.
- Successful response with unexpected data: contract or parsing failure.
One generic "Something went wrong" may be the right user-facing sentence. It should not be the only thing the system knows.
A request id connects the pieces
There is one small habit that makes this entire chain easier to reason about: give every request a correlation id.
The edge can create it, or the frontend can send one. Each service includes it in logs, and the response returns it as a header. Now a bug report can connect one browser event to the exact load-balancer entry, application log, and database operation.
const requestId = crypto.randomUUID();

await fetch('/orders', {
  ...options,
  headers: {
    ...options.headers,
    'X-Request-Id': requestId,
  },
});
That id is not observability by itself. But it gives the layers a shared thread, which is much better than comparing timestamps and hoping two errors belong to the same click.
What this changes in frontend code
Understanding the path does not mean the component should know about DNS or load balancers. Quite the opposite. It helps us create a cleaner boundary around network work.
A UI should know whether an action is pending, whether it can be retried, and what the user can do next. The API client should distinguish no-response failures from HTTP problems and invalid payloads. The backend should return structured errors. Infrastructure should expose enough context to trace the request across layers.
Each layer owns a different question.
The browser sees one request. The system sees a chain of contracts.
Once that picture is clear, several full-stack topics stop feeling unrelated. Idempotency protects a repeated request. Transactions protect a multi-step write. Redis changes where data is read. A load balancer changes where code runs. Observability connects the path after something fails.
They are all answers to the same question: what must stay true while a request crosses the system?
The next article follows the request into the application and focuses on the first contract we control directly: the API boundary.
If there is a part of the request path that still feels like a black box, tell me where you lose the thread. That is probably the part of this guide worth opening up next.
More than a blog post
I share frontend news and the reasoning behind it throughout the day. Pick the language that feels natural to you.